📈 Reading Statistics
Reading Statistics tracks your personal reading habits through 19 interactive charts. Access it from the stats button in the top bar.
Permission Required
Requires the Can Access User Stats permission or Admin role.
📖 Overview
Reading Stats visualizes your reading sessions, completion patterns, preferences, and habits. Charts update automatically as you read. Most charts support year or month filtering, and all include hover tooltips with detailed breakdowns.
📊 Charts
📅 Activity & Sessions
| Chart | Description |
|---|---|
| Reading Session Heatmap | Year-long calendar showing daily session counts with milestone badges (7-day streak, 30-day streak, 100 days, full year) |
| Favorite Reading Days | Distribution of reading sessions by day of week |
| Peak Reading Hours | Session count and average duration by hour of day, filterable by year and month |
| Reading Session Timeline | Week-based visual timeline showing session start/end times and duration per day |
| Reading Activity Heatmap | Compact heatmap of reading activity patterns |
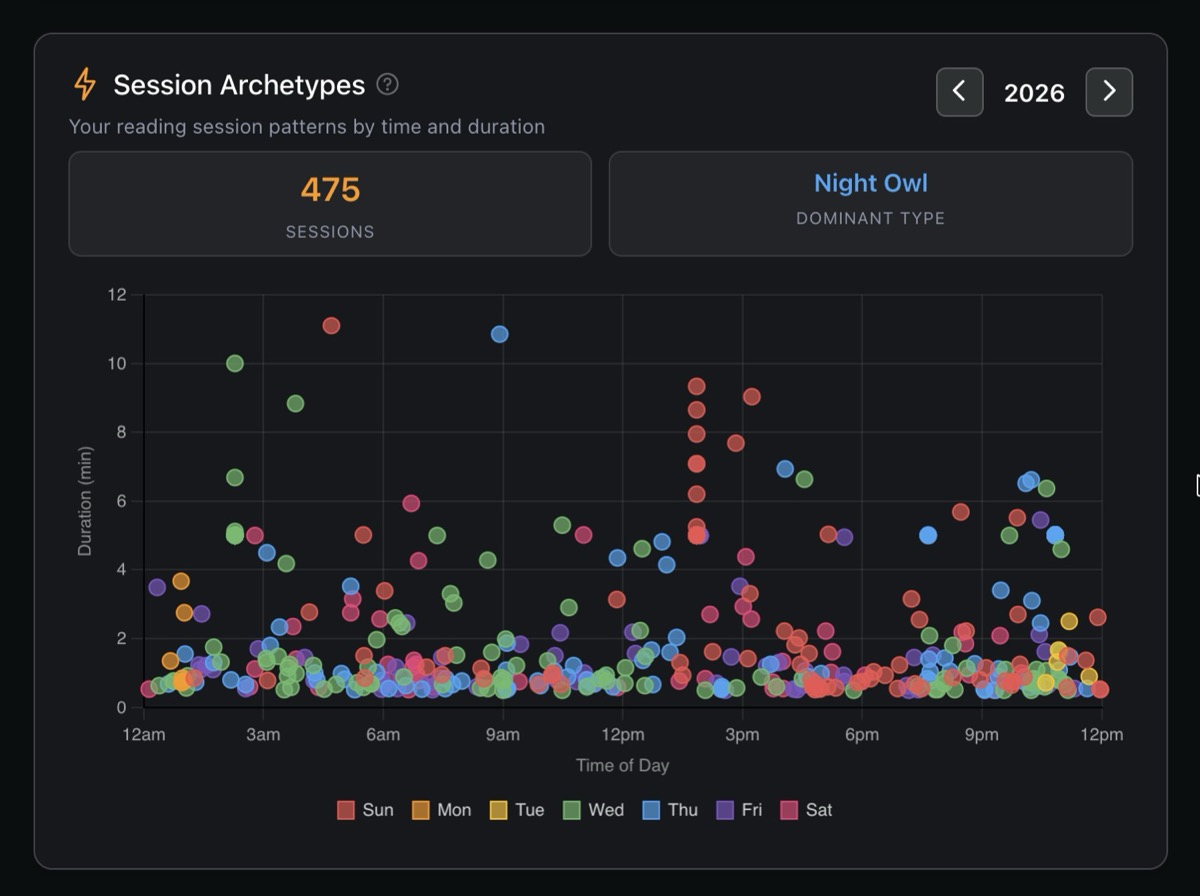
| Session Archetypes | Sessions plotted by time of day and duration, colored by day of week, identifying your dominant reading type (Night Owl, Early Bird, etc.) |
📚 Progress & Completion
| Chart | Description |
|---|---|
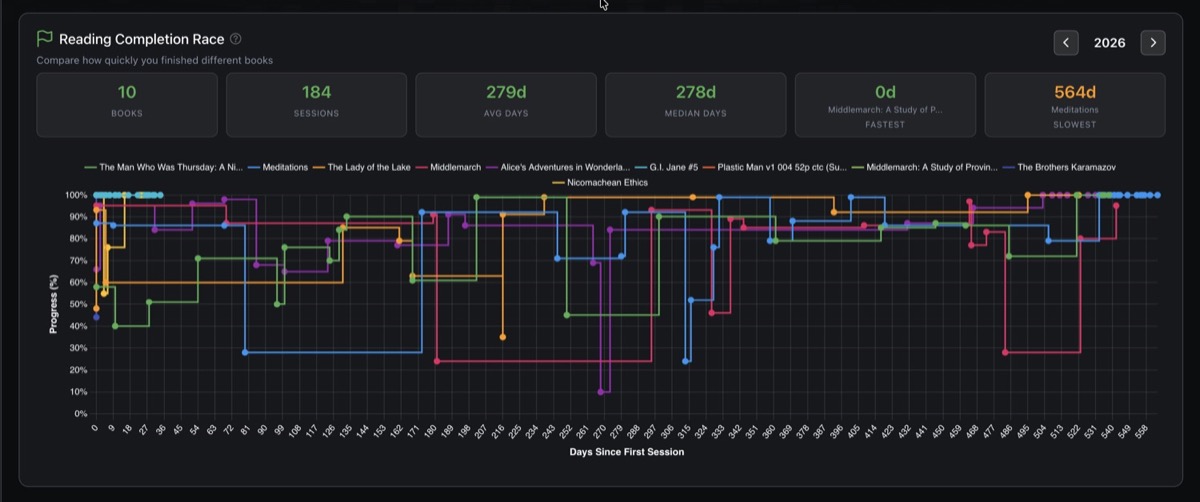
| Reading Completion Race | Multi-line chart comparing how quickly you finished different books, with stats for fastest, slowest, and median completion time |
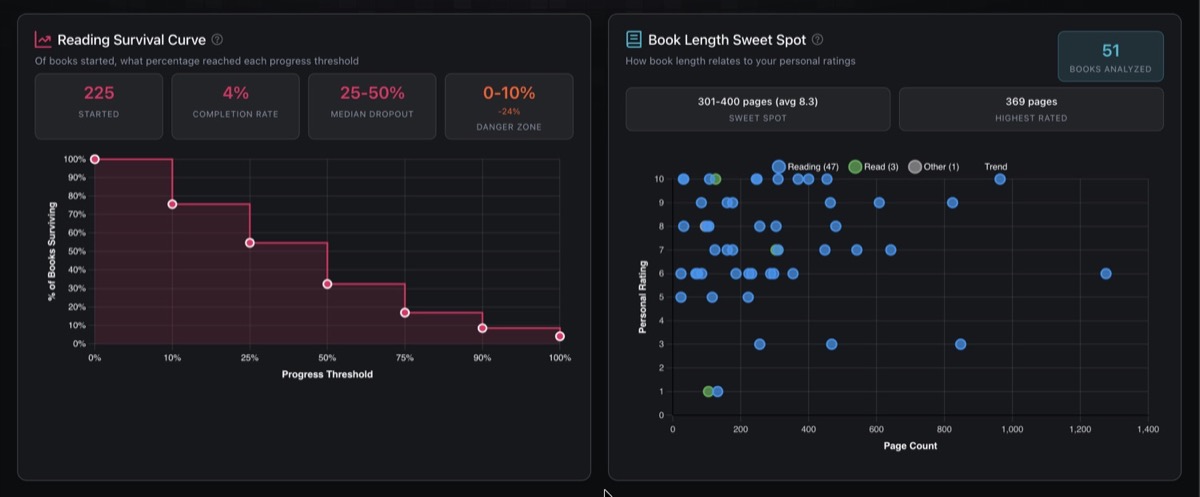
| Reading Survival Curve | What percentage of started books reach each 10% progress threshold, identifying the "danger zone" where most books are abandoned |
| Completion Timeline | Timeline of when books were completed over time |
| Reading Progress Distribution | Books grouped by completion percentage (not started, 1-25%, 26-50%, etc.) |
| Reading Status Distribution | Breakdown by status (reading, read, want to read, abandoned, etc.) |
| Series Progress Tracker | Your progress through book series |
🧬 Preferences & Personality
| Chart | Description |
|---|---|
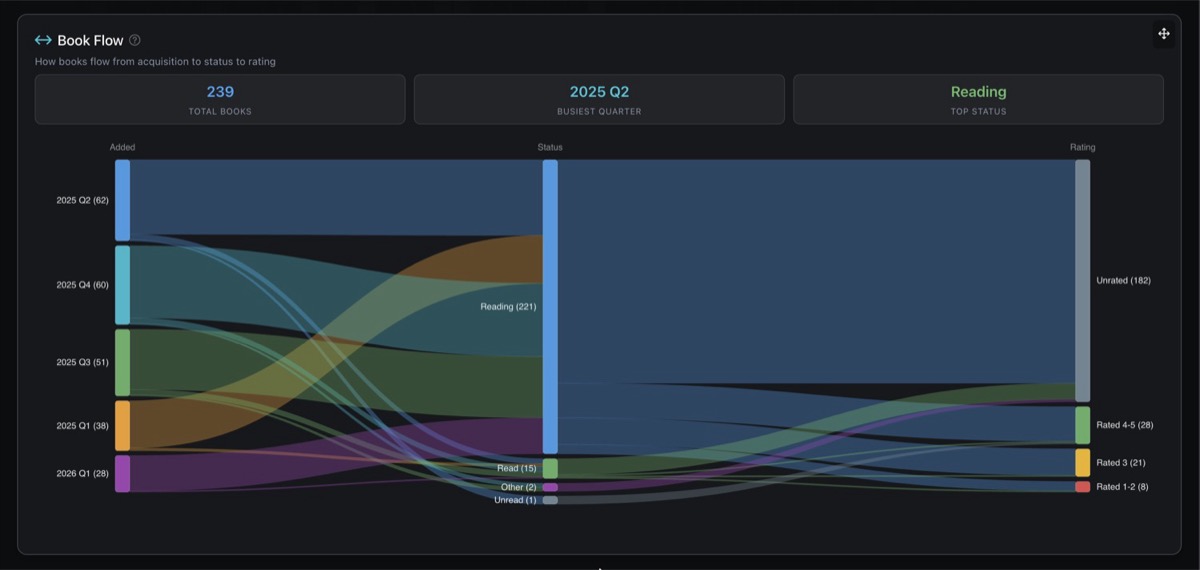
| Book Flow | Sankey diagram showing how books flow from acquisition quarter to reading status to rating |
| Book Length Sweet Spot | Scatter plot of page count vs personal rating, identifying your preferred book length |
| Genre Statistics | Total reading time spent per genre (top 35) |
| Reading DNA Profile | Radar chart analyzing 8 reading personality traits (adventurous, perfectionist, intellectual, emotional, patient, social, nostalgic, ambitious) |
| Personal Rating Distribution | Distribution of your star ratings |
| Rating vs Taste | Comparison between your ratings and external ratings (Goodreads, Amazon) |
📉 Trends
| Chart | Description |
|---|---|
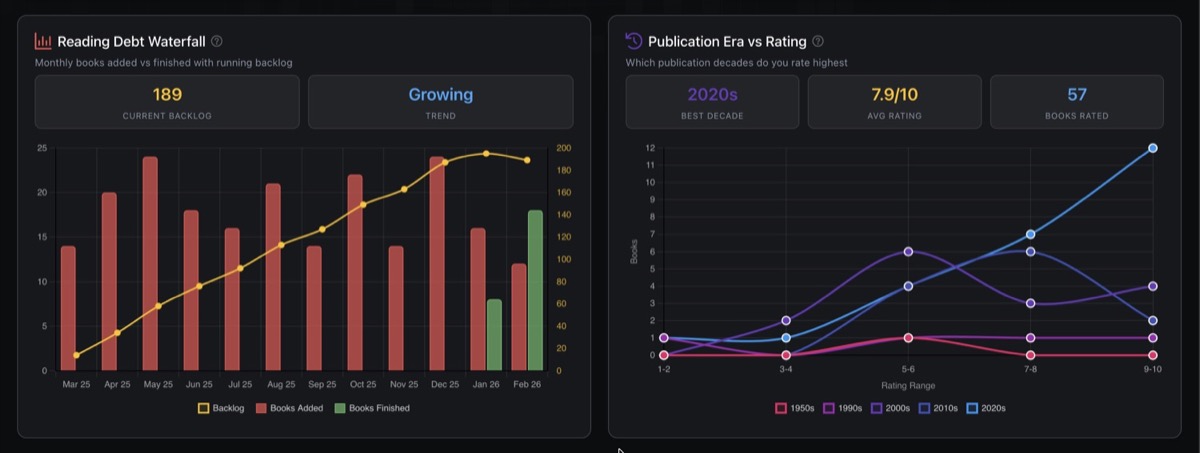
| Reading Debt Waterfall | Monthly books added vs finished with running backlog trend |
| Publication Era vs Rating | Which publication decades you rate highest, broken down by era |
⚙️ Customization
- Toggle charts on or off using the config panel
- Drag to reorder charts to your preferred layout
- Show all / Hide all for quick bulk toggle
- Reset to defaults to restore the original layout
Chart layout preferences are saved locally per user.