📊 Library Statistics
Library Statistics provides a visual overview of your collection through interactive charts. Access it from the stats button in the top bar.
Permission Required
Requires the Can Access Library Stats permission or Admin role.
📖 Overview
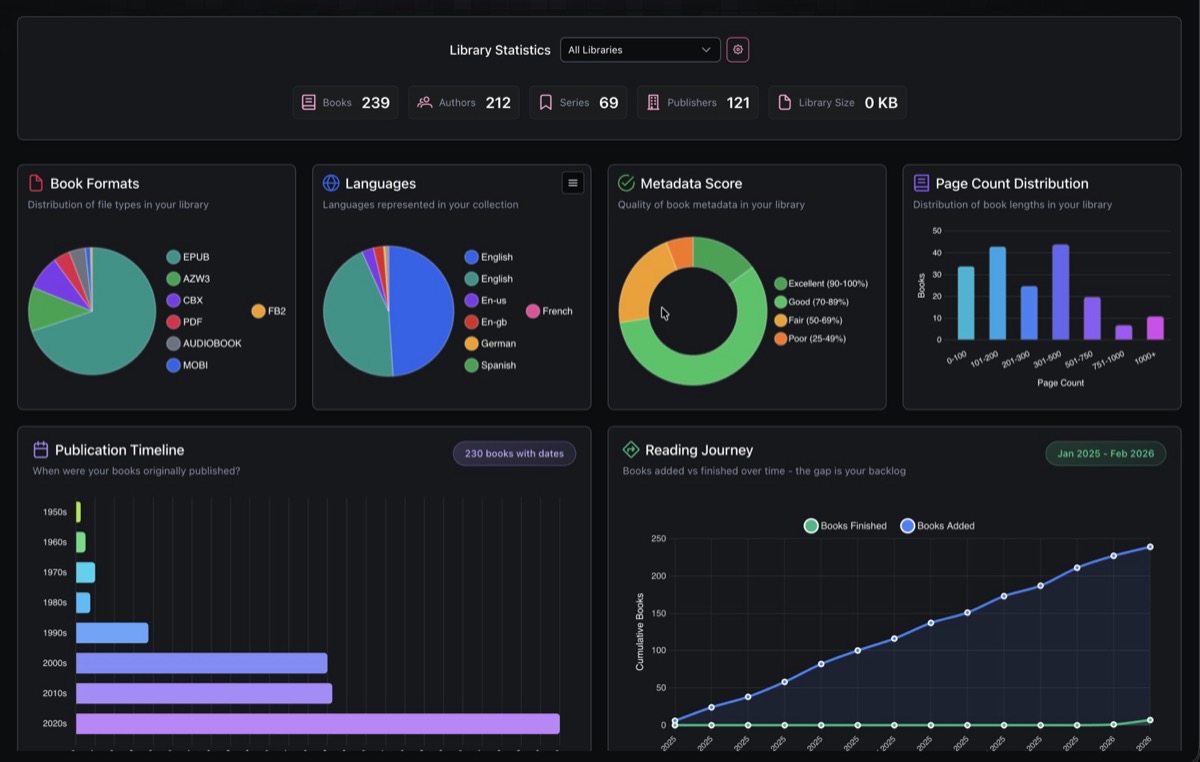
The top section shows summary counts for your collection: total Books, Authors, Series, Publishers, and Library Size.
A library filter dropdown lets you scope all charts to a specific library or view stats across all libraries.
📈 Charts
Nine chart types are available. Each chart includes hover tooltips and contextual insights (peak values, averages, trends).
| Chart | Type | What it shows |
|---|---|---|
| Book Formats | Pie | Distribution of file formats (EPUB, PDF, CBX, MOBI, FB2, Audiobook, etc.) |
| Languages | Pie | Languages represented in your collection |
| Metadata Score | Doughnut | Quality of book metadata rated from Excellent to Very Poor |
| Page Count Distribution | Bar | Books grouped by page ranges (0-100, 101-200, up to 1000+) |
| Publication Timeline | Horizontal Bar | Books grouped by decade (Pre-1900 through 2020s) |
| Publication Trend | Line | Number of books published per year |
| Reading Journey | Line | Cumulative books added vs books finished over time |
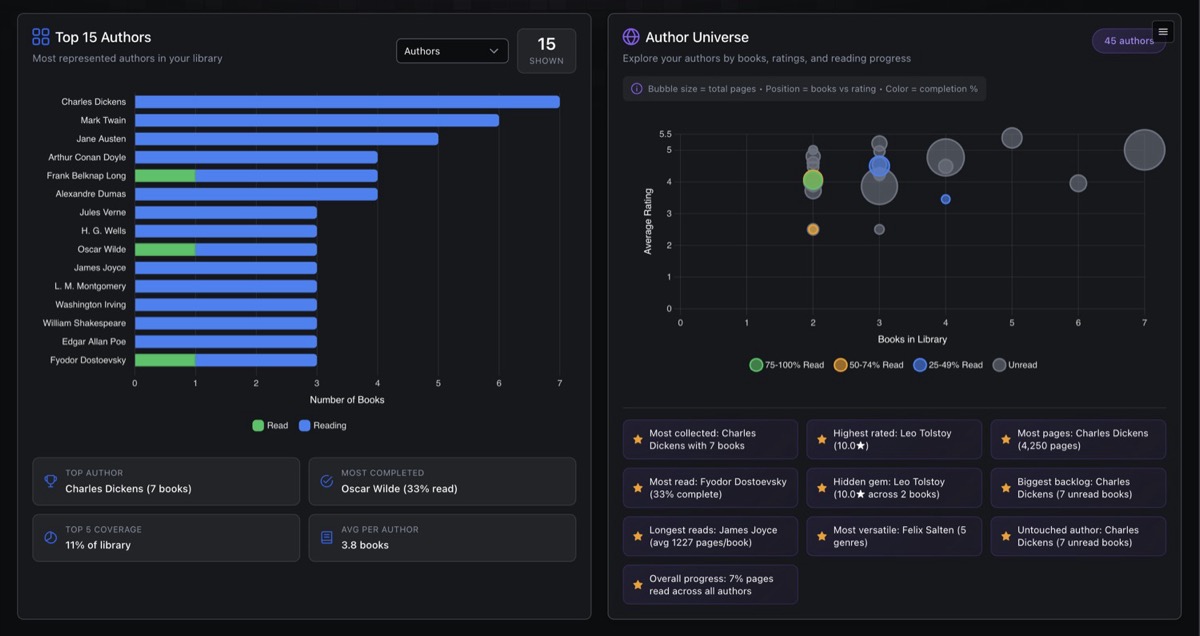
| Top Items | Stacked Bar | Top 15 by count with read status breakdown. Switchable between Authors, Categories, Series, Publishers, Tags, and Moods |
| Author Universe | Bubble | Authors plotted by book count (x-axis) and average rating (y-axis). Bubble size represents total pages, color indicates completion percentage |
⚙️ Customization
- Toggle charts on or off using the config button in the header
- Drag to reorder charts using the drag handles
- Switch categories in the Top Items chart via a dropdown (Authors, Categories, Series, Publishers, Tags, Moods)
Chart layout preferences are saved per user.